Visual Design and Data Visualization
Multinational Proptech Dashboard Design
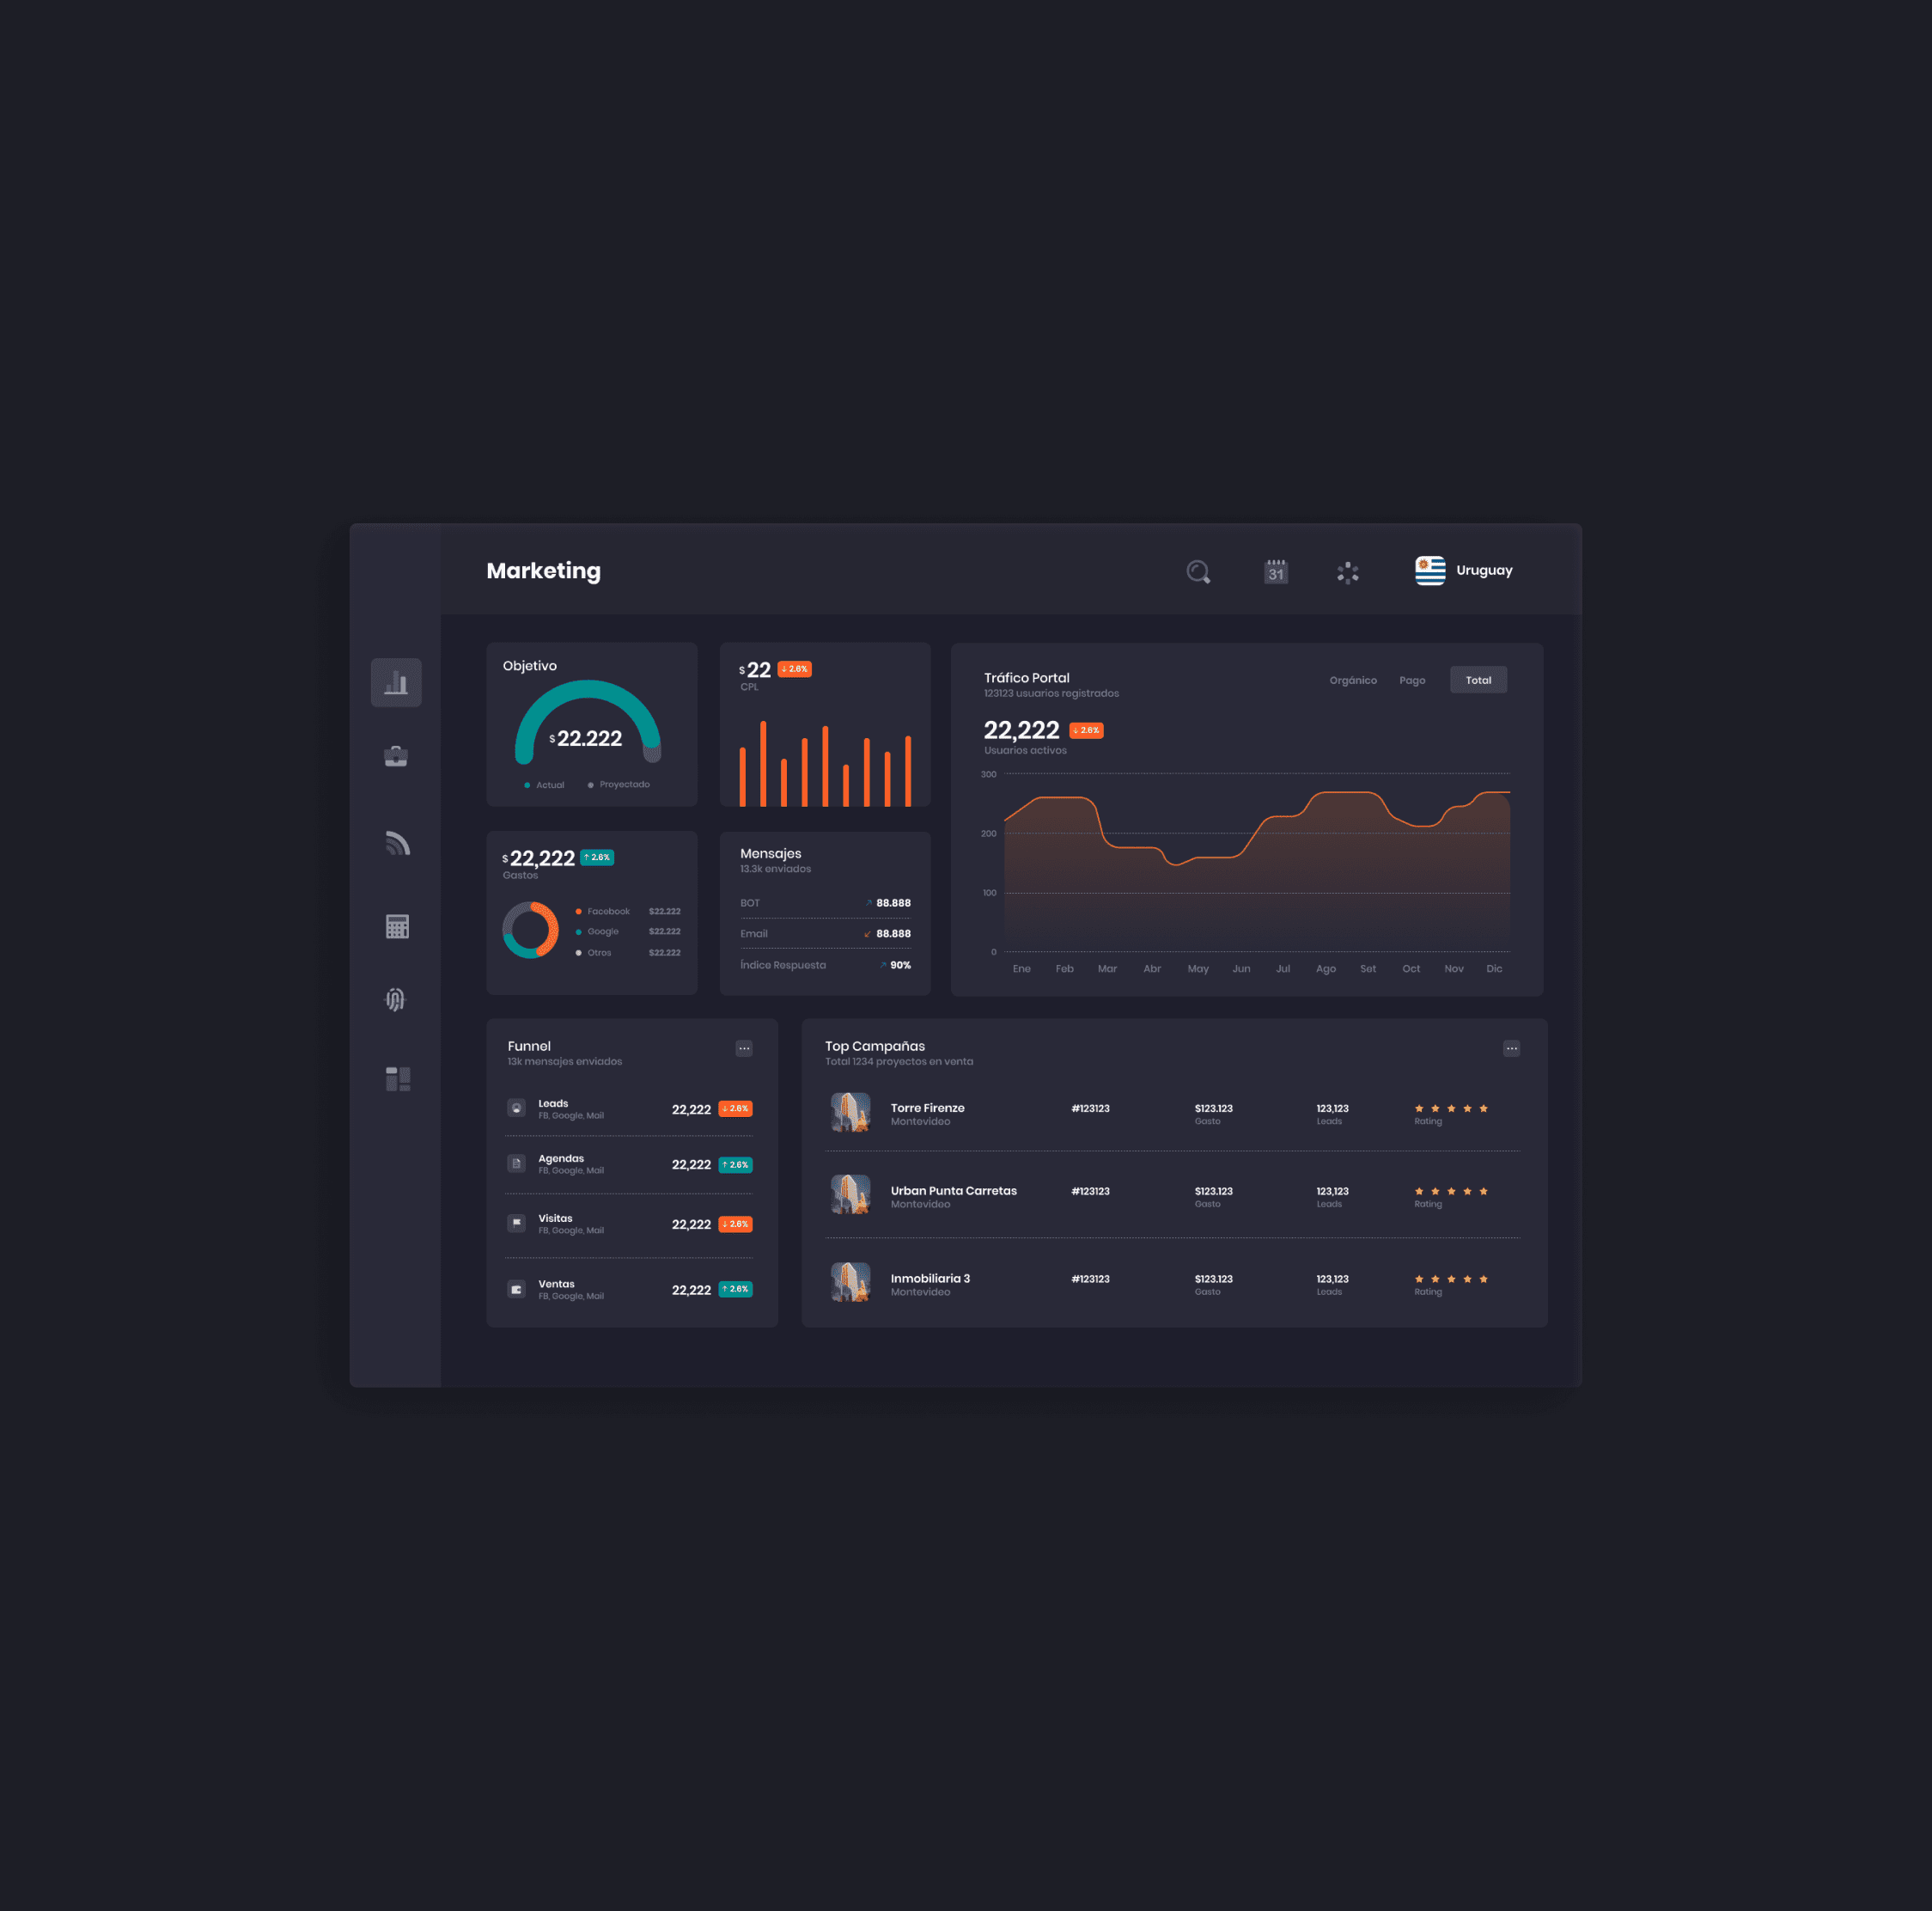
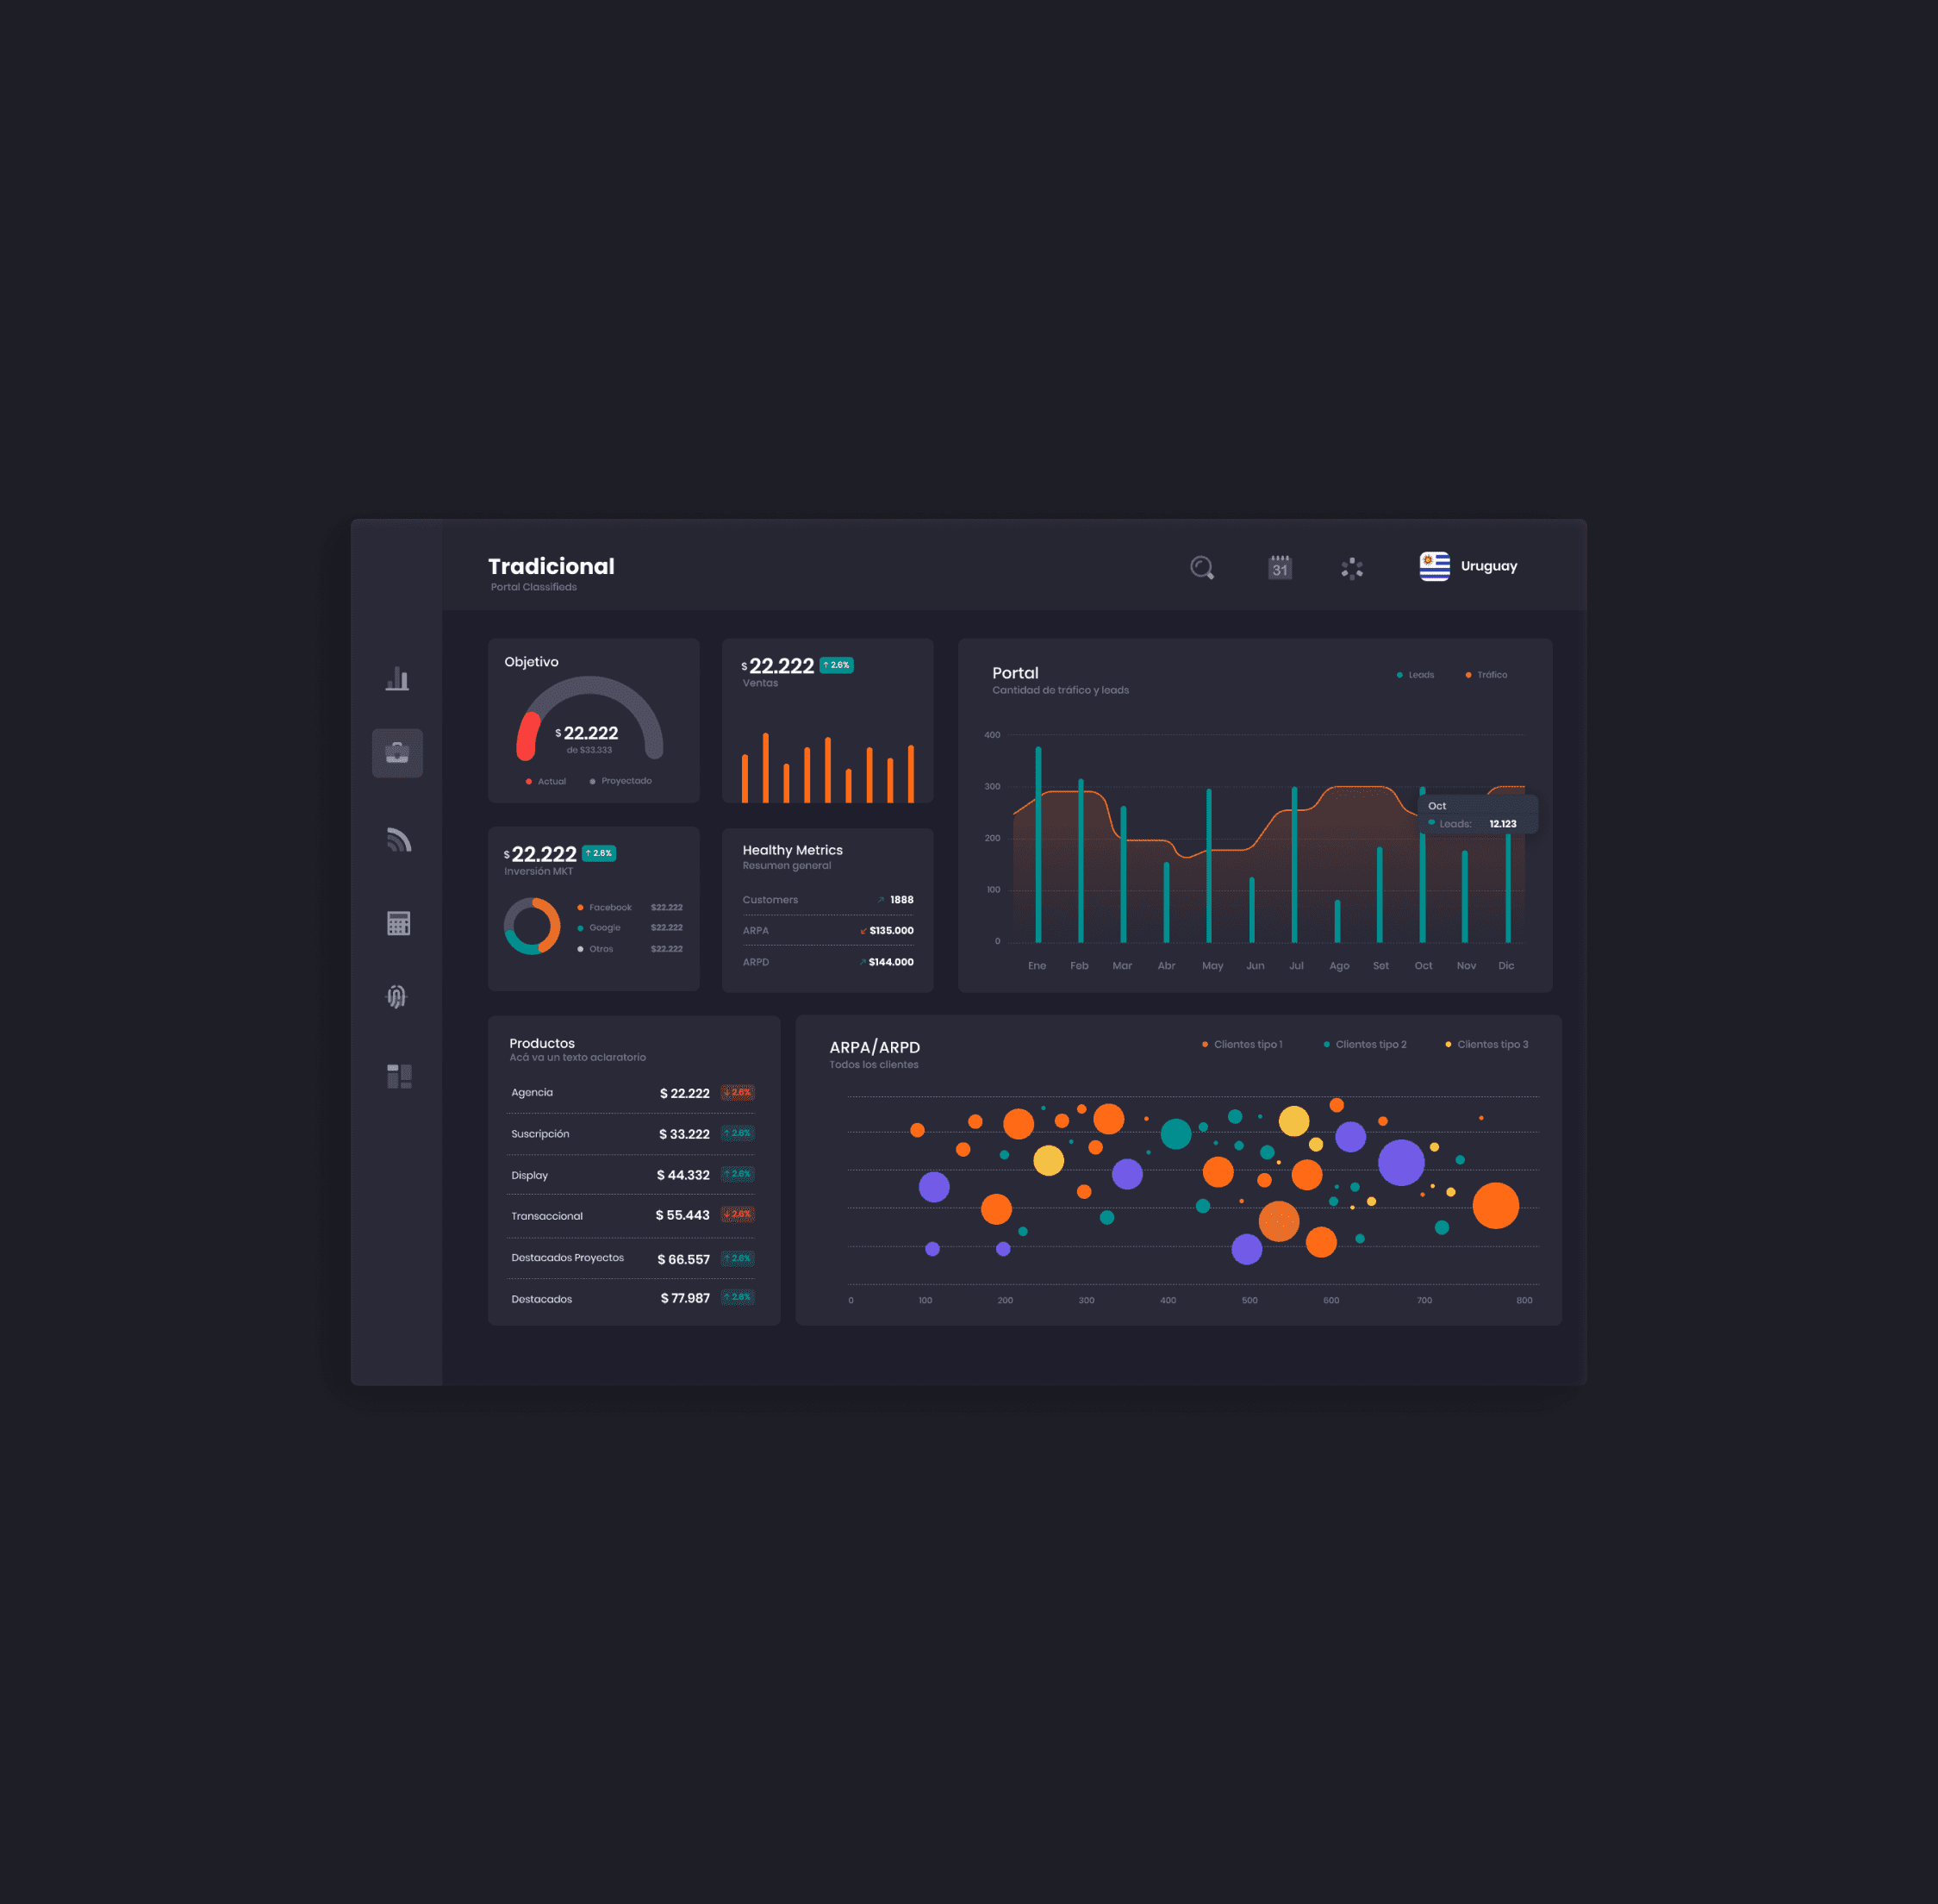
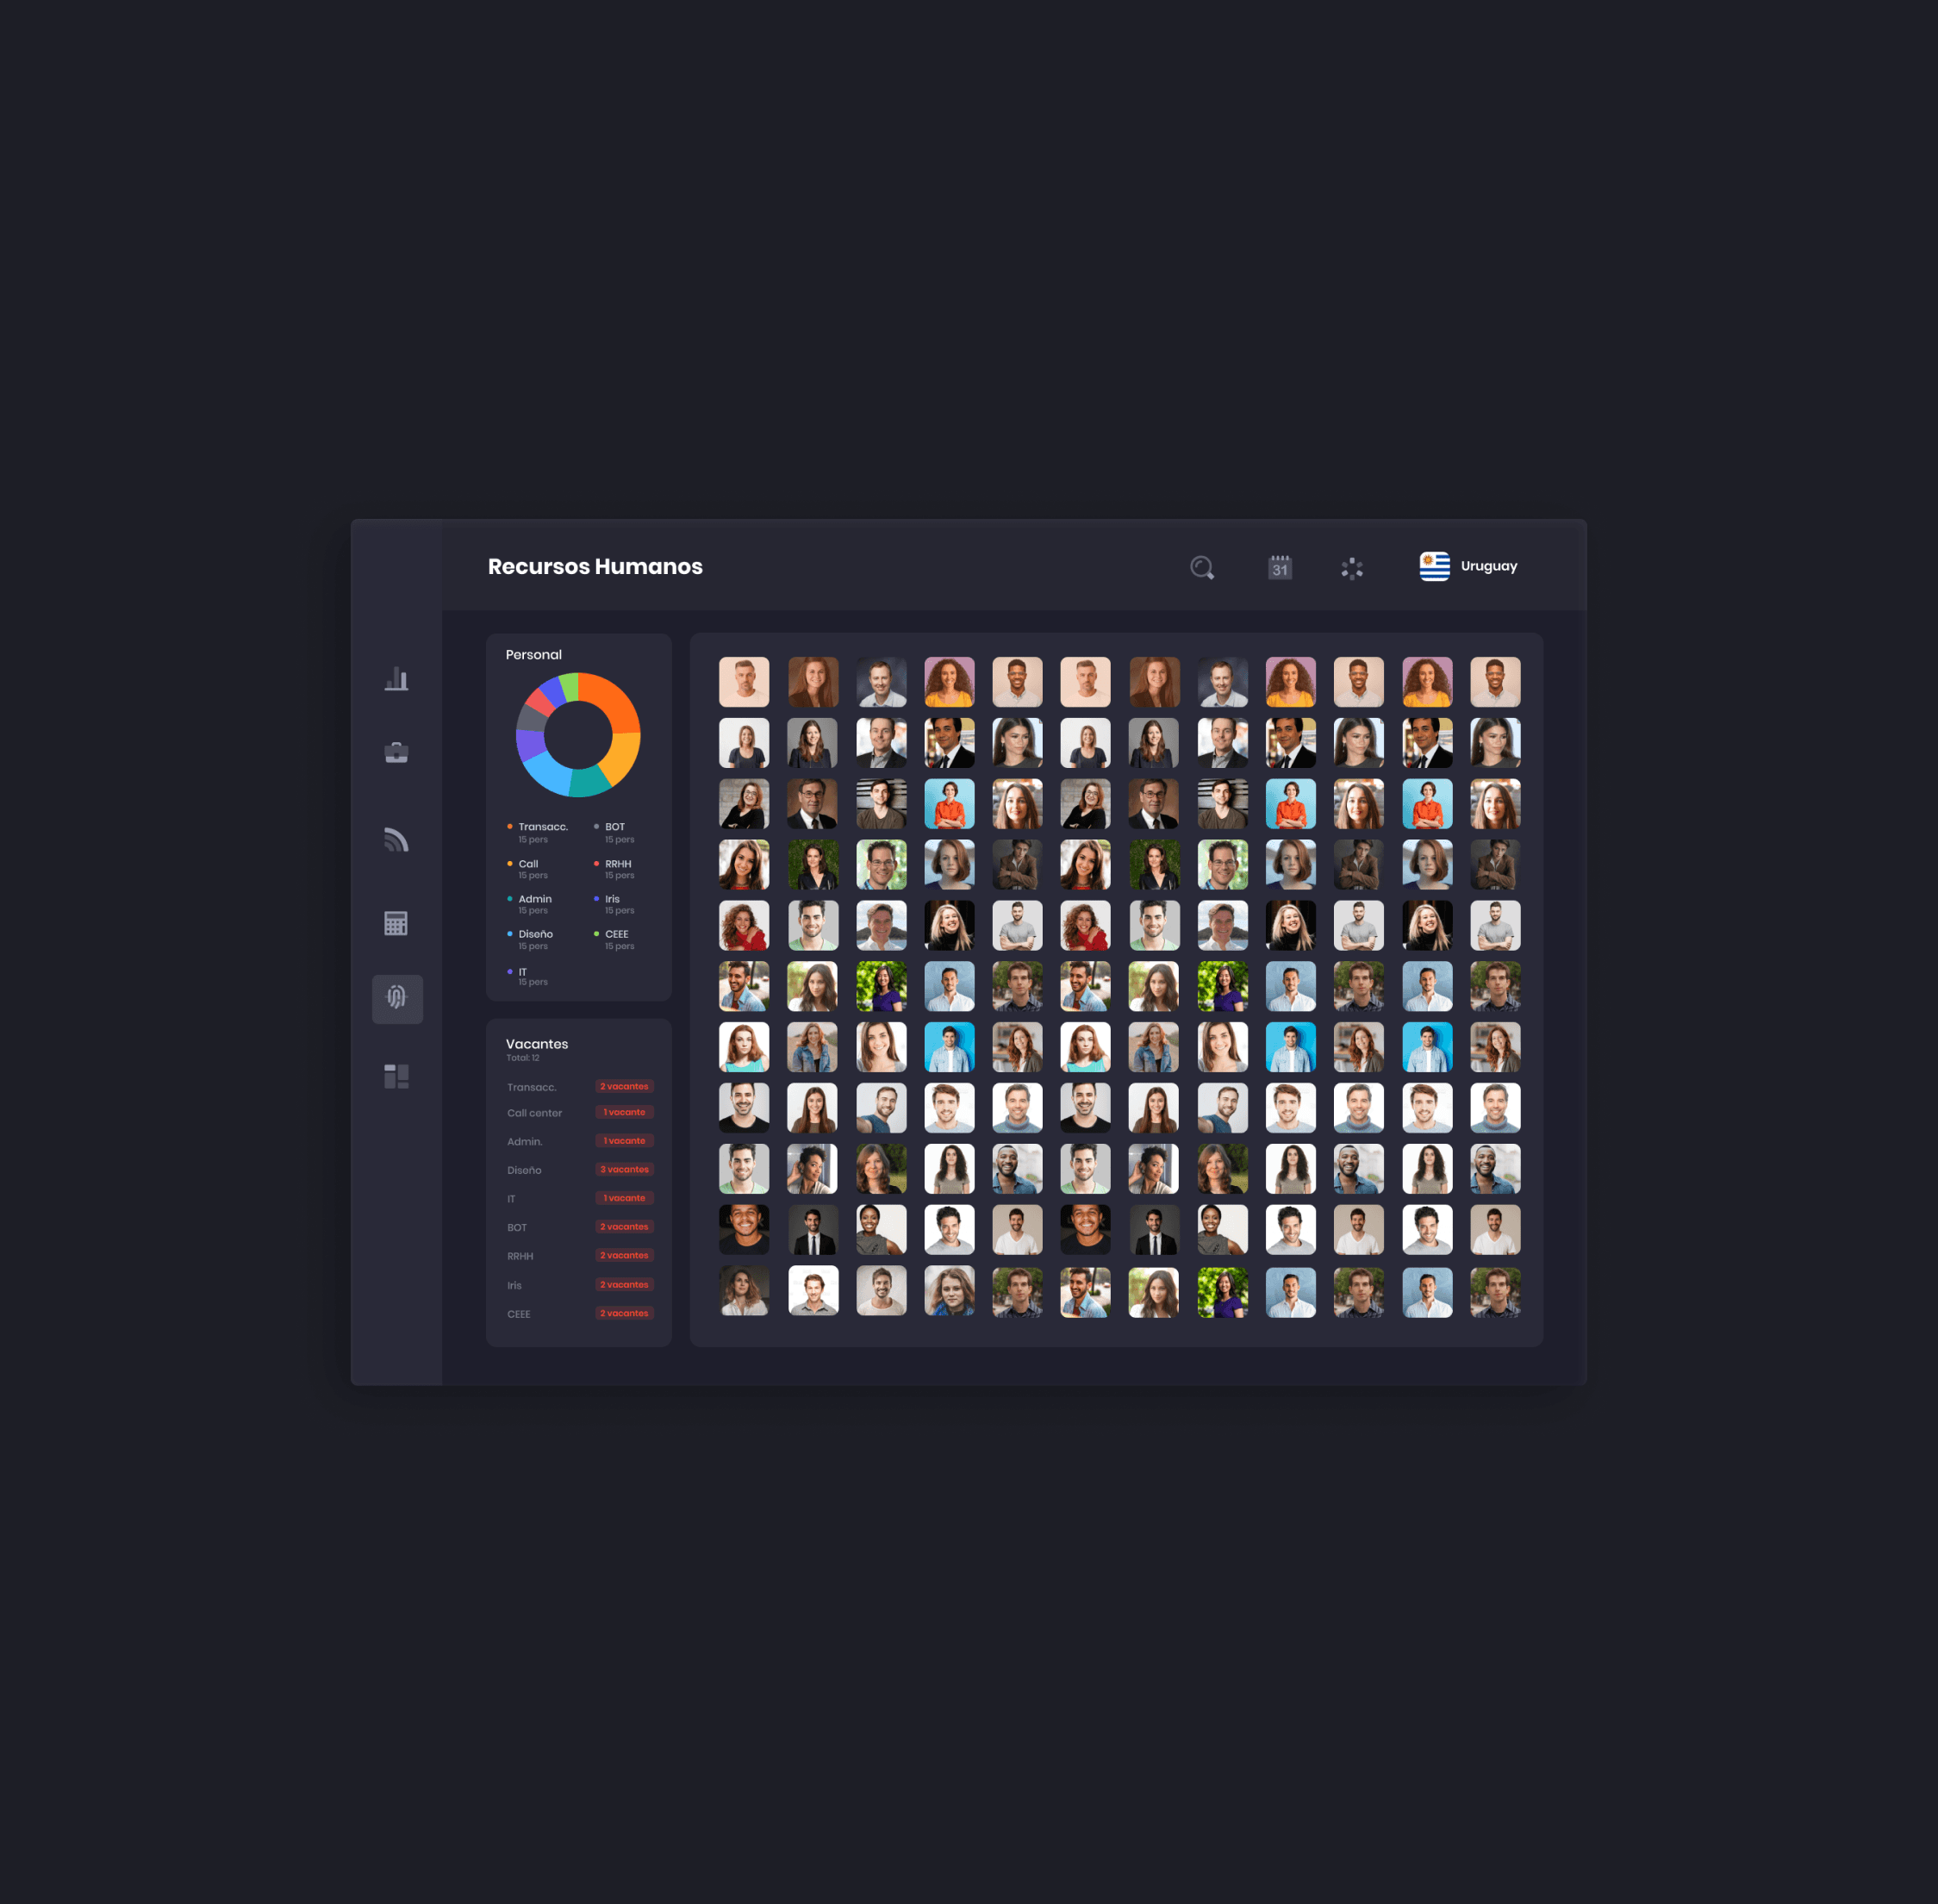
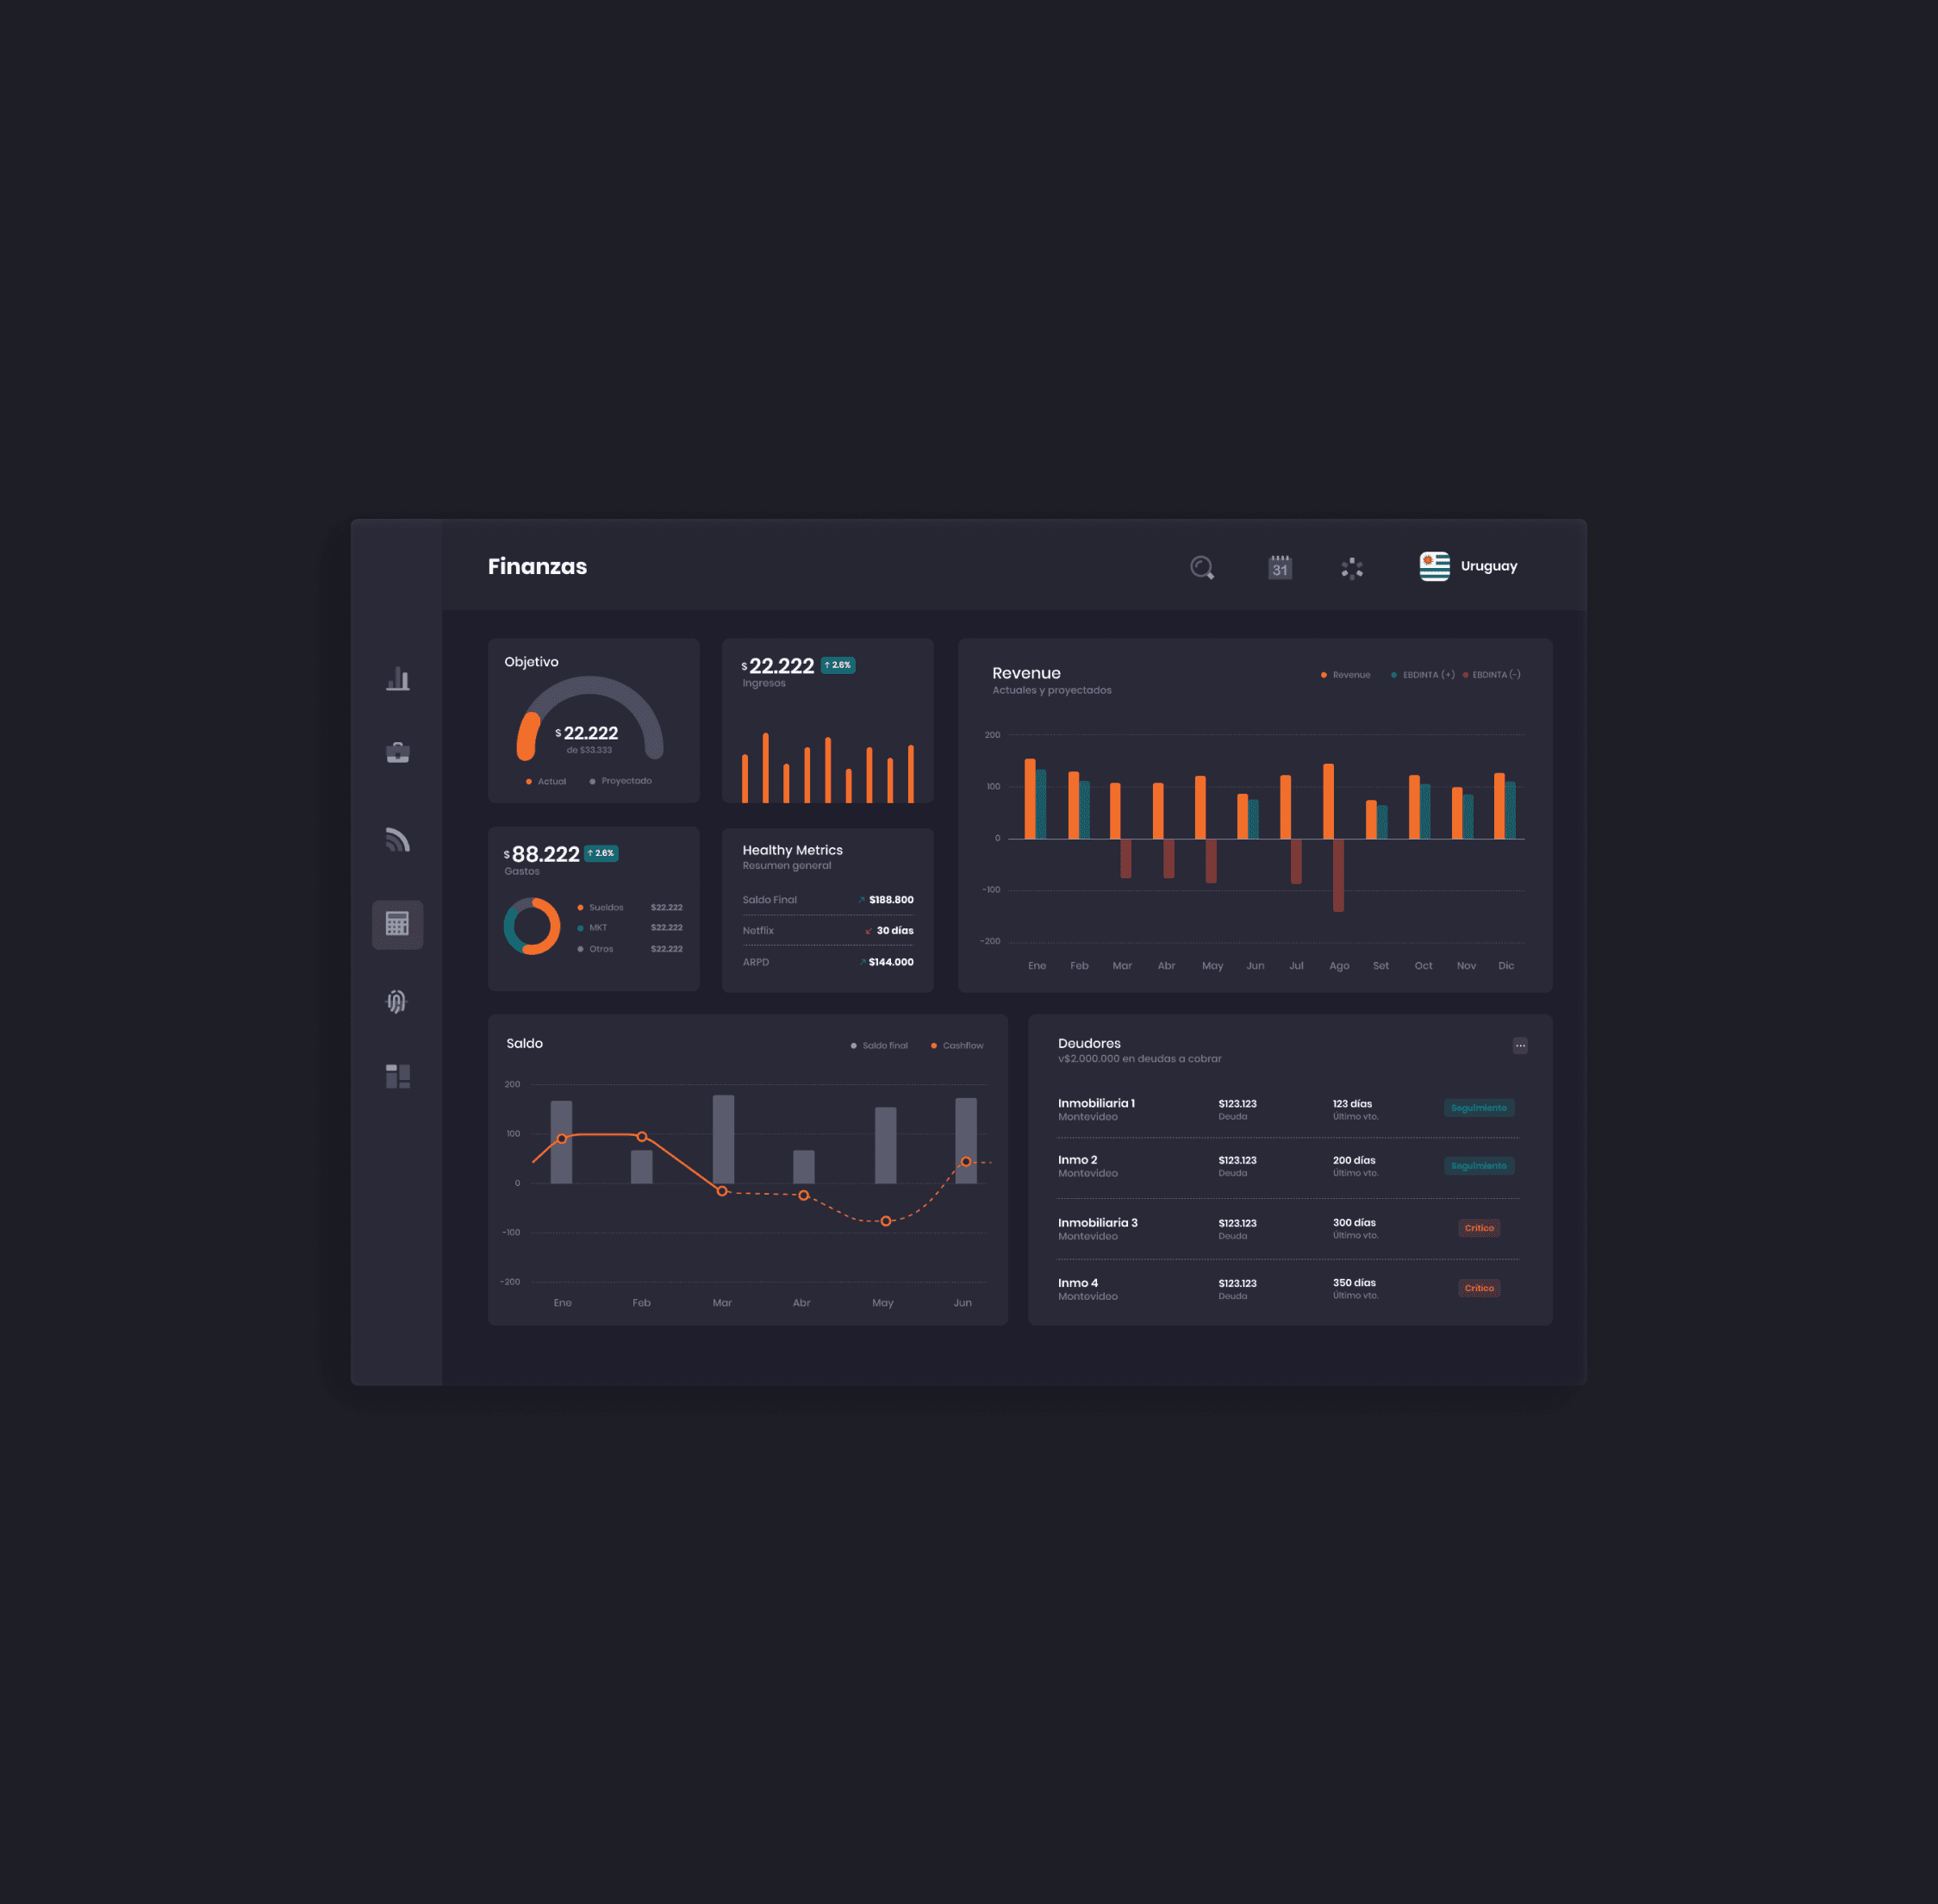
Discover how visualization can be taylored for a multinational company that relies on understand different market's data to take impactful decisions
Industry
IT & Tech
Headquarters
Uruguay
Founded
2010
Company size
100+
Overview
Infocasas is a proptech company that creates products, e-markets, and marketing strategies for real estate companies. They operate in Uruguay, Paraguay, Bolivia, and Peru. Their main objective was to expand into other Latin American countries, and to achieve this goal, they needed a fast way to track their data so C-level executives and investors could make decisions more easily.
Role
As a UX/UI designer with a strong focus on visual solutions, my role was to translate their needs into specific graphics that were both meaningful and understandable. I worked directly with the CTO, the data engineer, and the IT team.
Challenge
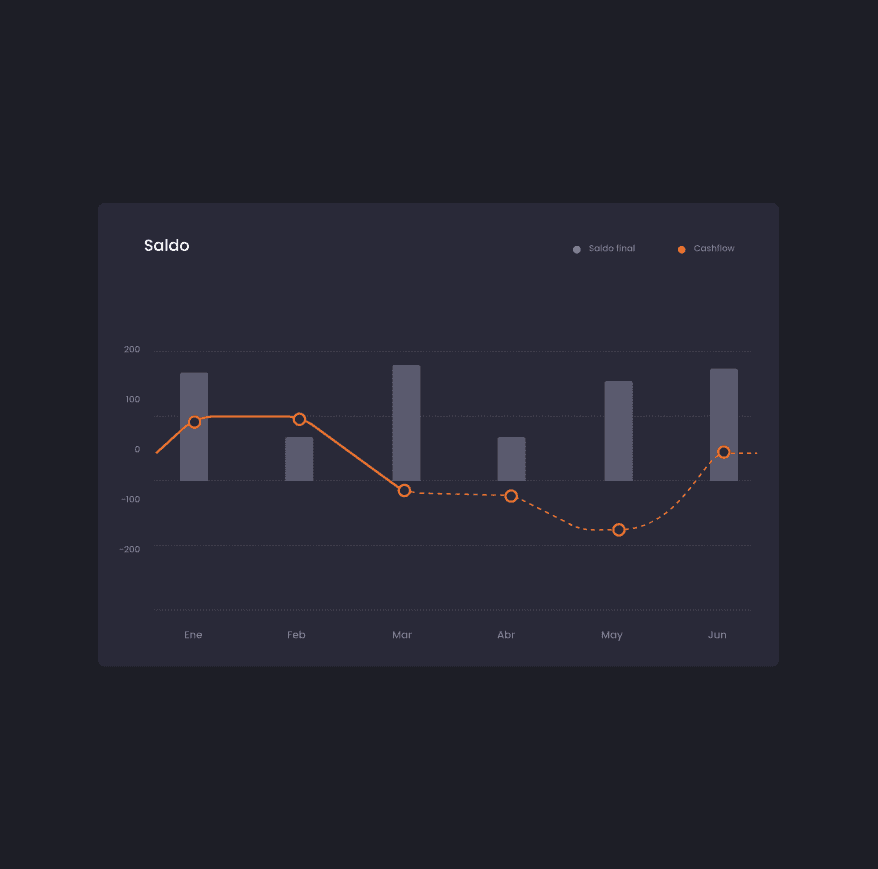
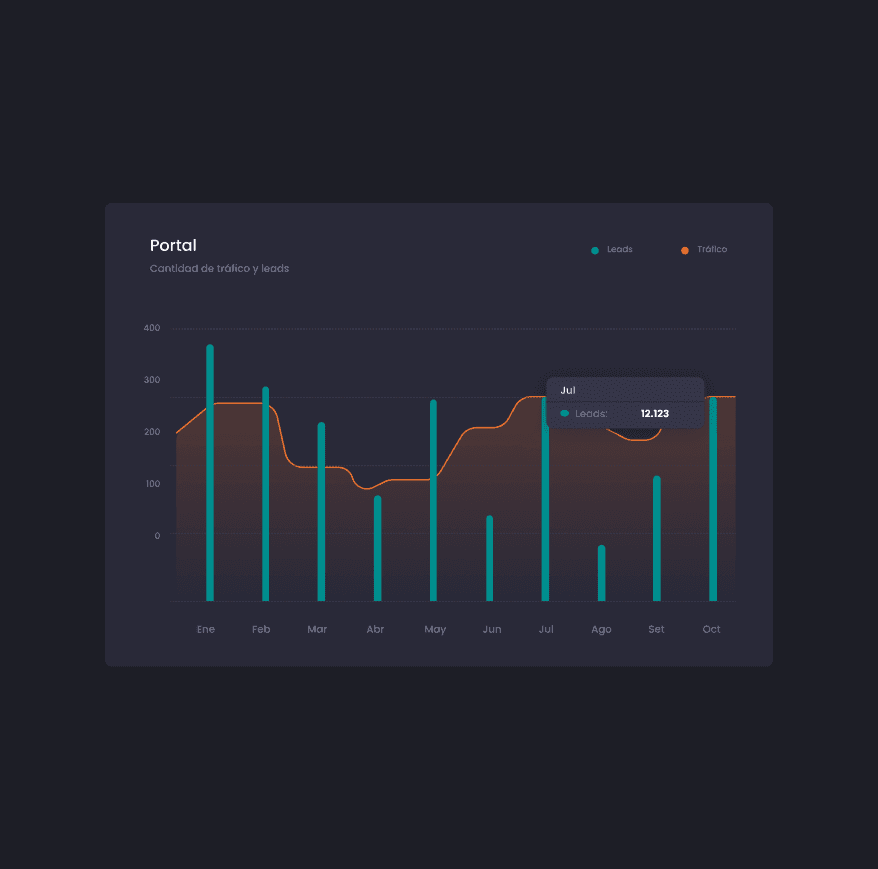
This project was challenging because, in a short amount of time, we had to define numerous visual representations, test them, and present various solutions that could maximize the cost-benefit of creating a customized data board.
Solution
We created a data board that could be used to present data for major decision-making. After some back and forth, we successfully defined the visuals necessary to create this tool. Projects like this are what keep Infocasas as a leader in their field.
